Above from today’s Guardian.
Apart from this graph’s headline sounding like a Daily Mail immigration scare story, what does it actually tell us?
Not much, and quite a bit.
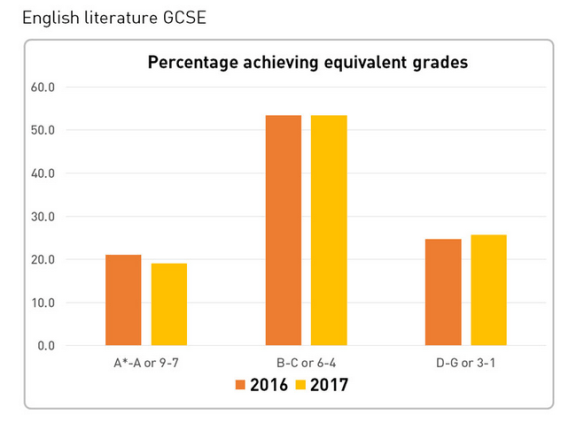
Significantly, very little has changed between 2016 and 2017 in terms of the two English and Maths results – the main subjects [along with Science usually, but not this year] by which schools are judged to have performed.
Why is this significant?
- It suggests Gove’s [and currently The Gibb’s] pontificating about ‘tougher’ exams making it harder to achieve the top grades – but also, by extrapolation, most grades, especially B-C now 6-4 – hasn’t been realised;
- And/or the grade boundary adjustments undertaken by Awarding Bodies, presumably with Ofqual blessing, have retained the status quo.
What else does it tell us about GCSE English, and Literature [my examining subject] in particular?
- That students, teachers and schools have had to work extra hard adapting to changes – closed-book, new texts, increased content, pressures to hit targets/Progress 8 especially for Eng Lit that was included in school performance/progress data – was an increase that did not [if my Maths is up to 2017 scratch-ability] warrant the ratio of bloodsweatandtears to the reality of securing the status quo.
Anything else?
- What we don’t know is how any individual students and individual schools will have fared with these changes: that is, whilst nationally percentage passes across grades have remained remarkably similar, they could be very wrong for some/many students and schools.
- None of this addresses the bigger issues of why there is a perception that GCSE examinations need to be tougher/more robust [apart from satisfying the compulsion for such regular political rhetoric], and why we continue to examine students like this at age 16.
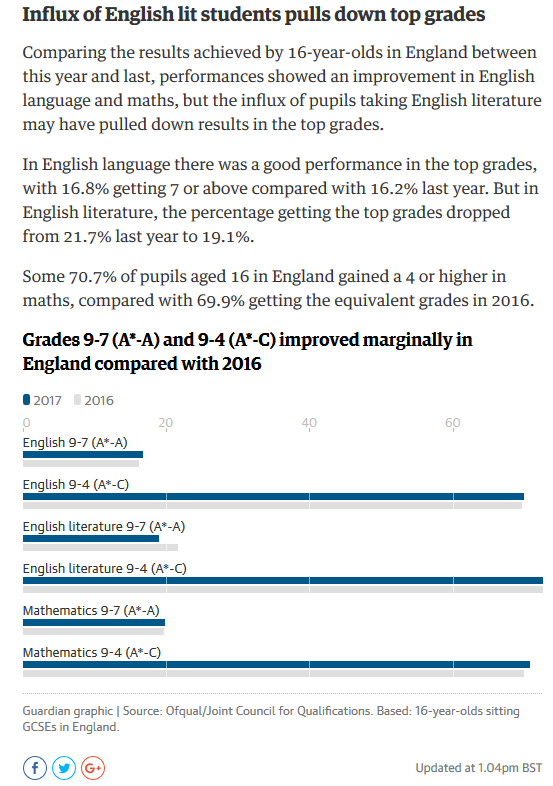
Another graph, from Schools Week, for visual learners: